




I admit that I didn’t watch as many non-Giants games as I have in the past nor did I really consume much news about the field, so I suppose this feeling of mine is absent many facts, but, it didn’t feel like the 2026 season was a particularly below average run-scoring environment or a strange year in that record. And yet, Rotoworld’s Matthew Pouliot posted some facts to social media yesterday that caught my eye:
Ignoring strike years/2020…
.316 average is lowest to lead the majors ever
45 homers is lowest total to lead the majors since 2014
116 RBI is lowest total to lead the majors since 2014
119 runs scored is lowest total to lead majors since 2014
40 doubles is lowest total to lead majors since 1972
There was also a note about how just three qualified hitters had an OPS of .900 or better, tied with 1976 for lowest of the live ball era. But seeing that trio of 2014s stacked on top of each other reminded me of this 30 Rock joke:
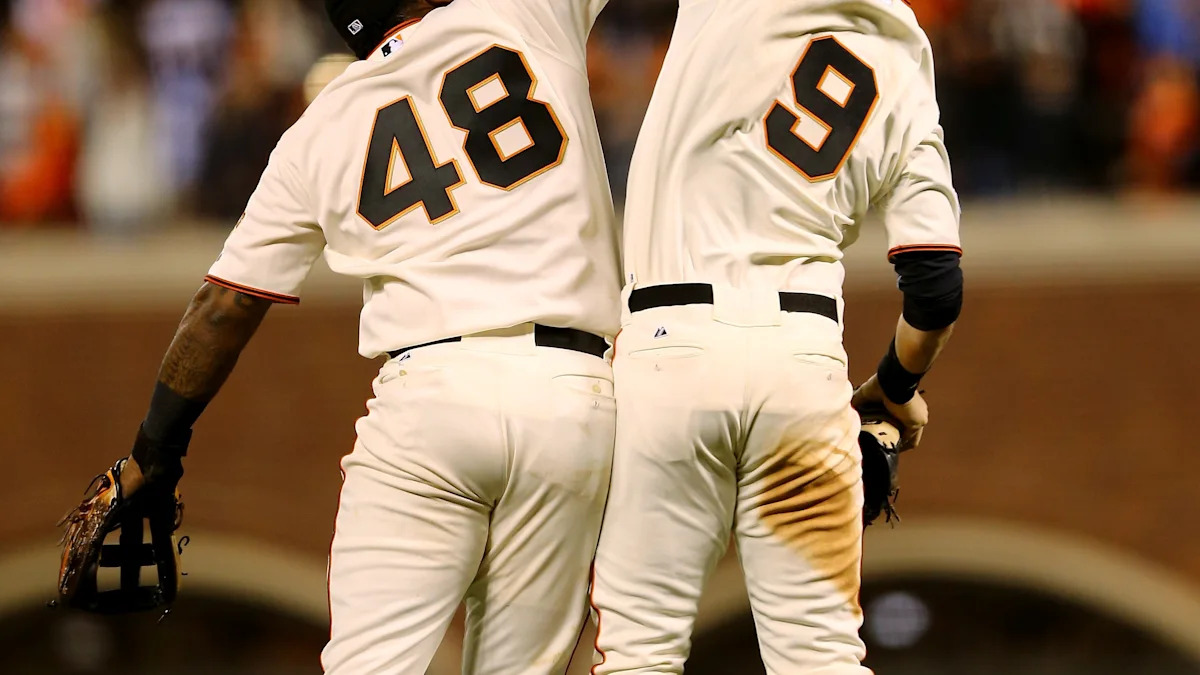
Somehow, Buster Posey and Zack Minasian have made it 2014 again through science or magic. The 2026 Giants look a lot like the last San Francisco squad to win the World Series. So, for comedy and trolling purposes, I took a look at the team statistics for both seasons (ranked by the 27 seasons in Oracle Park)…
|
_____________ |
2026 |
2014 |
|
Lineup fWAR |
13.1 (20th) |
25.7 (11th) |
|
Runs Scored |
669 (18th) |
665 (19th) |
|
Offense |
97 wRC+ (16th) |
99 wRC+ (12th) |
|
Defense |
-38.2 Def (26th) |
+55.1 (14th) |
|
BB% |
7.4% (21st) |
7.0% (26th) |
|
K% |
22.1% (20th) |
20.5% (18th) |
|
AVG |
.245 (20th) |
.255 (16th) |
|
OBP |
.306 (23rd) |
.311 (20th) |
|
SLG |
.400 (11th) |
.388 (19th) |
|
ISO |
.155 (11th) |
.133 (19th) |
|
SB |
88 (5th) |
56 (22nd) |
|
Singles |
875 (20th) |
976 (5th) |
|
Doubles |
262 (21st) |
257 (22nd) |
|
Triples |
26 (22nd) |
42 (6th) |
|
Pitching fWAR |
9.8 (17th) |
9.4 (18th) |
|
Runs Allowed |
760 (23rd) |
614 (6th) |
|
Team ERA |
4.34 (20th) |
3.50 (4th) |
|
K/9 |
7.58 (17th) |
7.52 (18th) |
|
BB/9 |
3.75 (25th) |
2.42 (1st) |
|
HR/9 |
1.01 (23rd) |
0.83 (5th) |
|
WHIP |
1.36 (19th) |
1.17 (2nd) |
Okay, so, there’s not much of a comparison to be had, especially on the pitching side (which I only included to show how different the pitching environment was then), but there are some superficial similarities. The biggest, and most meaningful, difference is in the defense, where this putrid 2026 wound up being, effectively, 9 games worse than the 2014 team just from their poor glove work alone. This year’s team was the second-worst of the Oracle Park era, behind only the Joc Pederson Giants of 2022 (-66.2).
The defense and league average offense is how the Giants were able to get into the postseason, while the 2022 Giants tried to overcome their terrible defense with stellar pitching (20.3 fWAR — 7th in MLB) and a lineup they thought would be quite a bit better than league average (102 wRC+ — 14th). The 2026 squad seemed to be setup to follow a similar pattern to that… but if you’re a mean guy like me who thinks it’s funny to imagine Buster Posey basing his team management philosophy on sitting back and recalling what they did from 2010-2014, then it feels more likely that the Giants said, “Well, in 2014, it was Madison Bumgarner and some guys plus timely hitting and solid defense.” Slide Logan Webb into the Bumgarner role with younger pitchers around him than what MadBum had in 2014 and envision Matt Chapman, Willy Adames, Ron Washington-enhanced Luis Arraez, and Devers/Eldridge at first base snatching up all those grounders. And Bader in the outfield running down everything else. It was a perfect plan… for trying to recreate that specific season of San Francisco Giants Baseball.
But, as we know, it didn’t work out. Instead, the 2026 Giants were 18th in runs scored out of 27 seasons at Oracle Park (yes, the 60-game 2020 season is included and, of course, comes in last at 299 runs). Sure, just slightly more than a World Series team, but balanced against that is a team that allowed more runs than the 2005, 2007, and 2018 teams. The attempt to 2014-ify the pitching staff failed completely. They struck out 1,204 hitters, just 7 fewer than the 2014 team, sure, and that was bad enough for that time period (21st), but they were 27th in MLB this year behind only the Rockies (1,113), Diamondbacks (1,140), and Royals (1,173). The team ahead of them? The Cubs, but with 1,260.
In the prior front office’s heyday of 2021-2024, the Giants 8.74 K/9 as a team was merely 16th in MLB. But the past two seasons has seen a steep decline in what’s the coin of the realm in the sport these days — the one big skill that can help out a team with poor defense: strikeouts! Last year, the Giants were down to 8.52 K/9, and you see where they landed this season on the chart above.
Just in looking at this data, a real stinker like me could pitch an argument that Farhan Zaidi, the computer programmer with the allegedly poor people skills and who had never played the game at a professional level before, had a better sense of building a pitching staff than Hall of Fame-bound catcher Buster Posey, guider of one of the best pitching staffs the Giants franchise has ever had. Here are the top 10 strikeout seasons since 2000:
2009: 1,302
2016: 1,309
2011: 1,316
2010: 1,331
2025: 1,358
2023: 1,359
2019: 1,368
2022: 1,370
2021: 1,425
2024: 1,436
It is a great irony that the top strikeout pitching staff of the Oracle Park era so far was led by Bryan Price. He is a pitching coach from the prior era Buster Posey seems to be harkening back to whenever he considers how to construct his teams. But you see on this list Dick Tidrow & Brian Sabean Michael Jordan & Scottie Pippening a post-Bonds pitching staff along with Farhan Zaidi, Andrew Bailey, Brian Bannister, and a bunch of supercomputers running regression analysis.
The Giants were also far less successful at stymying home runs, too. The 160 allowed is the fifth-most in the Oracle Park era, trailing only 2004 (161), 2023 (173), 2017 (182), and 2019 (227) aka The Last Year of the Competitive Window with Bonds, Gabe Kapler’s Final Season, Bobby Evans’ Final Season, and Bruce Bochy’s Final Season. They also allowed the third-most walks of the Oracle Park era, trailing only the 2000 (623) and 2008 (652) teams.
Not saying that Zack & Buster can’t get there, but this year makes it seem like they have a loooooong way to go in that respect (developing a very successful pitching staff).
But back to the lineup, since this is where the comparison to 2014 really matters. From May 1st through July 31st, the Giants had a team wRC+ of 107, tied with the Tampa Bay Rays. They hit 104 home runs in 79 games. For basically half the baseball calendar, they were as good as any modern team on the hitting side of the ball. We know the injuries put an end to that over the final two months of the season, but you can see how close to the 2014 model this actually is: good hitting backed up by solid defense to stabilize shaky but not terrible pitching. The Giants’ bad defense made their shaky pitching genuinely one of the worst acts of labor ever enacted in the entirety of human history.
The Giants’ emphasis on contact isn’t a bad one, especially if they’re able to handle high velocity. To that point: they ranked 10th in batting average vs. 95+ mph (.247), but just 21st against 97+ (.214). But you can also look at the numbers and see just how devoted to the 2014 project they just might be. On the season, they bunted 67 times (11th in MLB), but 35 of those bunt attempts (52.2%) came after July 31st, when they traded everybody away and started ILing everybody and the offense tanked. Is this a shift in philosophy or simply strategic change based on personnel? It’s genuinely hard to know.
But also, it’s worth pointing out that the Tampa Bay Rays led MLB in bunt attempts this season (129). Second? The Milwaukee Brewers (89) — two of the best teams in the sport doing something most analysts had discounted more than a decade ago? The Giants hit 178 home runs this season (20th in MLB) to go along with all those bunt attempts and (yes, I’m cherry picking), before they lost their entire starting lineup to the IL, they had one of the lowest strikeout rates in the sport, too (6th in MLB through 7/31). It really does read like the Giants put together a lineup that is well equipped to compete in the modern game and it happens to be similar in a lot of ways to the type of lineup that worked when the Giants last won the World Series.
Of course, they didn’t totally pin down what made 2014 work so well. They forgot about the winning. But maybe that’s just my sense of entitlement as a fan and as someone who has watched the franchise sputter and basically die over the past decade (with apologies to that explosion of endorphins that was 2021). But this comparison is interesting to me. It turns out that I was trolled. Maybe everything old is new again, to the point that Buster Posey’s 2010s nostalgia recipe is just what the franchise needs.
In a perpetual rebuild situation, any clear idea is a good one.
Read the full article here


