


Today I would like to take a look at who Baseball Savant’s statcast evaluation style compares our current favorite baseball players to. We will use a Savant tool to show a Cardinal hitter profile, and see how it compares with the stats we use every day. wRC+ means weighted runs created, and the + means it has been adjusted to compare a player to league average. 100 is average.
Burleson so far best compares to Adley Rutschman’s hitter profile. Burleson barrels a few more, but he also strikes out a little more. They both can be gotten out by poorly topped and poorly under hits. All in all they are pretty similar from a hitter’s profile perspective. The .88 correlation outdoes the other players close to Burly’s style. Another notable player is Freddie Freeman!
The difference in execution: Burleson has a higher on-base percentage, and Rutschman has a lot more power.
Winn vs Bazzana
Here, we find a much more questionable correlation, but we are looking at batter profiles here. Not necessarily production.

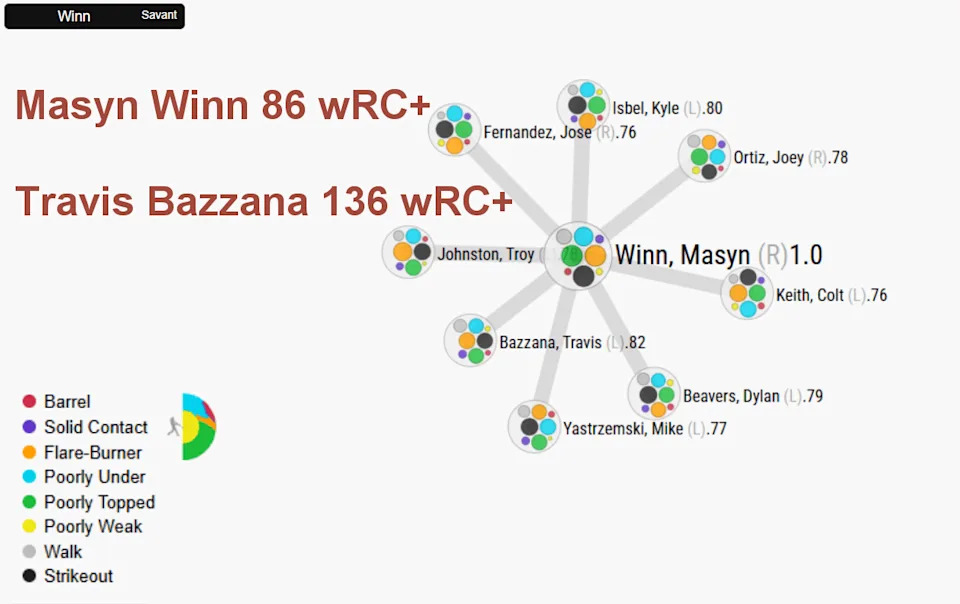
What do I hope this means? Winn has a lot of unlocked potential if he compares closest to a Travis Bazzana hitting profile at .82 correlation. This is not as strong a correlation as in the previous example, but Travis Bazzana is the closest. If Winn can up his hitting across the board, this is the absolute ceiling. He will need to lower his K rate a little bit, take a few more walks, and maybe turn more of those flare burners into harder-hit balls, and of course, tap into his full potential. If he comps closest to a good hitter, this is encouraging.
What does this really mean? Kyle Isbel is another close comp, who matches up closest in offense stat categories, as well as the hitting profile. Isbel is probably a little worse hitter than Winn, but is more where Winn wants to be on the ISO charts. Isbel may be the floor comparison, as his walk rate and strikeout rates are even worse than what Winn has done this year.
Why are left-handed hitters comparing most closely with Winn’s hitting profile? I have no idea, but maybe he hits it the opposite way a lot.
How about Ivan Herrera? So far in 2026, JP Crawford is his closest player similarity score by statcast.

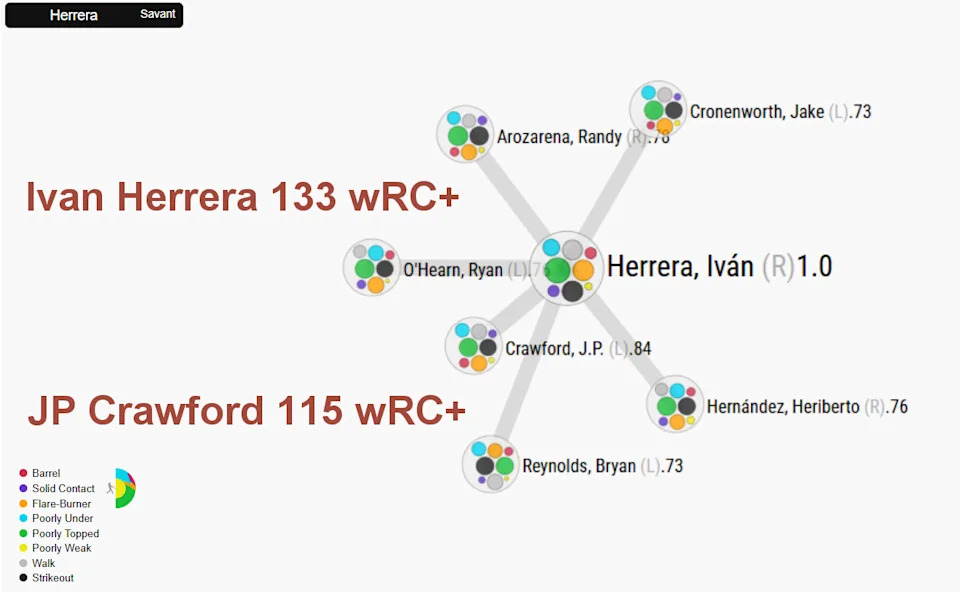
First off, Crawford has a terrible BABIP of .226 this season. So that might explain some of the difference in the wRC+ score. Herrera has a relatively normal BABIP of .296. Somehow Crawford has outdone Herrera in BB% with a ridiculous 15% walk rate. It probably helped that he walked 3 times last night! I was surprised ANYONE had a higher walk rate than Herrera, but this is next level. They have nearly the same ISO, but Crawford strikes out more. However, they both poorly top the ball a lot, and have their fair share of flare burners.
It is also notable that Randy Arozarena is his second closest player similarity score by batting profile.

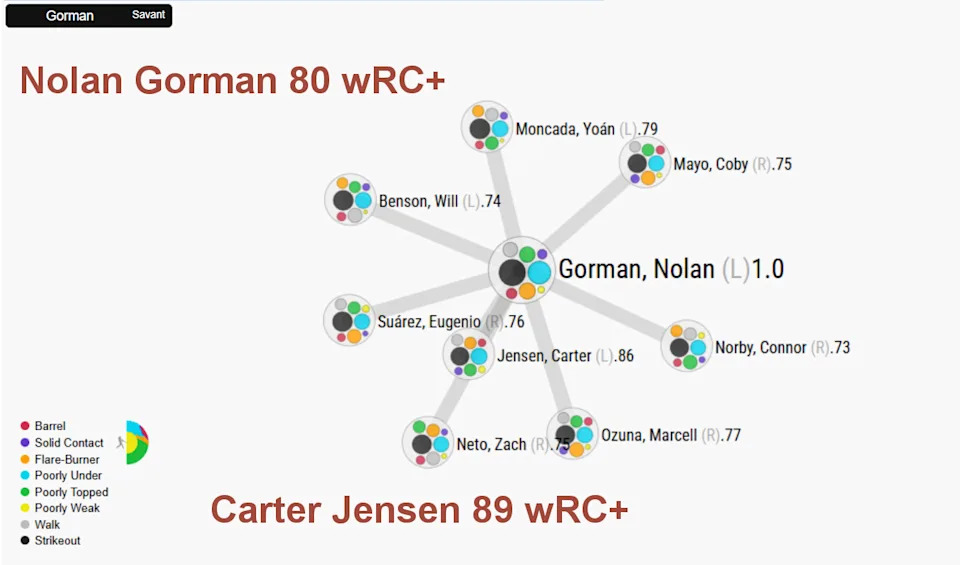
Gorman and Jensen both walk at about the same rate, but as we all know Gorman’s K rate is next level. Jensen’s is not far behind though! Both players have 7 HR and a low BABIP, suggesting they might both get a little better. Gorman and Jensen are going to suffer a poor K rate, together in spirit.
The black circles in the graphic above are for Strikeout, and Gorman and Jensen lead the pack with that black hole in their swing. Do we like the 2nd closest hitter profile comparison in fellow third baseman Yoan Moncada? No, no we don’t. Moving on!
JJ Wetherholt and Jordan Walker don’t compare all that closely with any hitters just yet, so I”m going to profile them later in an article, with more in-depth coverage. I’d like to see Nathan Church play more first, as well.

My my, how things have changed! And look at that guy Nootbaar all over the leader boards. The more things change, the more they stay the same. I hope he’s ok, and able to have a career second half.
I will get back to the music writing soon, if I can find the time! I ran out of time again tonight. Next week…
Thanks for reading.
Read the full article here


