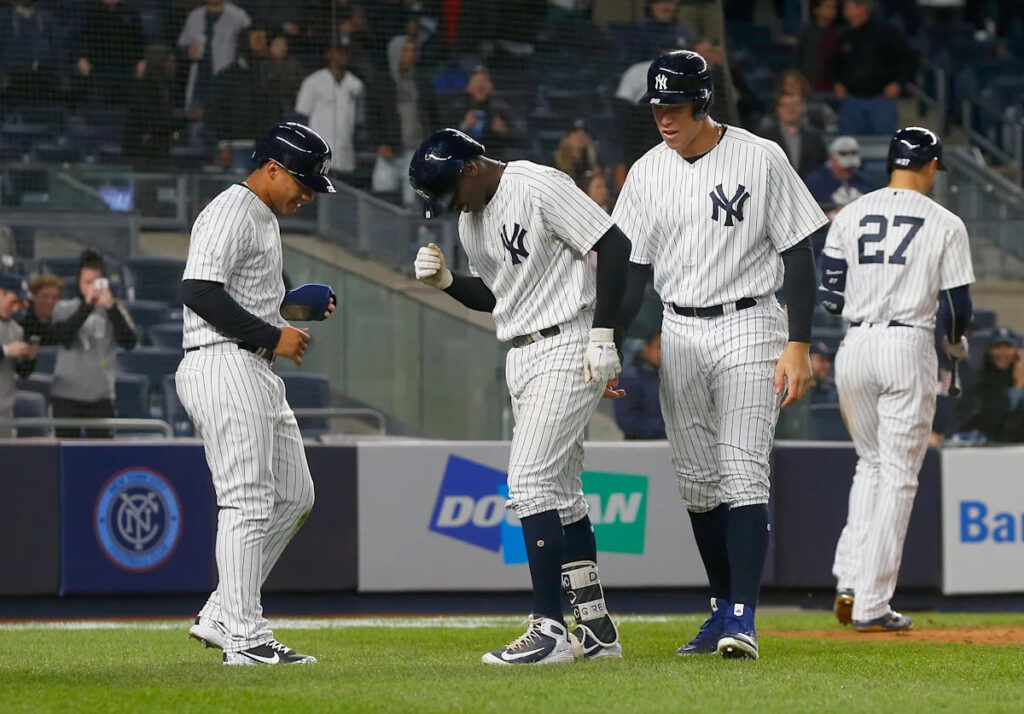
While he’s been better of late, Trent Grisham slumped in much of the early going of the season. That became a bit more problematic than it would be as he’s spent much of this season as the Yankees’ leadoff hitter. Through Wednesday, Grisham was posting a .678 OPS while hitting first in the Yankees’ order,
The thing is, those struggles haven’t been as prevalent in pretty much any other spot in the lineup. In all other plate appearances besides the ones in the one hole, Grisham had a .854 OPS going into Thursday. This got me thinking about the randomness that often come within season splits. However, I was intrigued by the opposite of what’s happening to Grisham this year. I wanted to know what seasons Yankees’ players had where they absolutely went off while hitting in one particular spot in the batting order.
To try and figure this out, we’ll mainly be using two statistics available via Baseball Reference: tOPS+ and sOPS+. What tOPS+ does is measure how you did in a certain split compared to your overall numbers for the season. For example, a 120 tOPS+ means you were 20 percent better than in a given split than your overall numbers. Meanwhile, sOPS+ compares numbers in a certain split to the major league average. A 120 there means your numbers in that split were 20 percent better than the league average within that same split. We’re also going to put a minimum of 100 plate appearances on this to get a look at players who legitimately played there a bunch, and not just ones who had like one at-bat in a spot and happened to homer.
Batting 1st: 1957 Hank Bauer (143 tOPS+, 171 sOPS+)
Hall of Fame shortstop Phil Rizzuto had the highest tOPS+ in this spot with 154 in 1954, but he didn’t actually hit all that great there (sub .700 OPS), he just did better there than anywhere else in one of the final years of his career. Instead, we’ll go with Bauer, who might have not have had the typical description of a traditional leadoff hitter and put up a .776 OPS overall for the season. However, he hit 16 of his 18 homers when Casey Stengel put him first in the order.
Batting 2nd: 1920 Bob Meusel (167 tOPS+, 228 sOPS+)
When I saw Meusel was especially dominant hitting second in 1920, my initial thought that he probably got a boost from hitting directly in front of Babe Ruth. However most of the time, Ruth was fourth in the lineup with Wally Pipp batting third. Pipp was very much respected in his day, but Meusel just happened to go off whenever he was second in the order, hitting .414/.436/.739.
Batting 3rd: 2022 Gleyber Torres (174 tOPS+, 171 sOPS+)
While 2022 was a few years after his juiced-ball peak, he was still an above-average hitter that year. He did especially well hitting third, which often came with the benefit of hitting after one of Aaron Judge, Anthony Rizzo, or Giancarlo Stanton. In 119 plate appearances there, he had a 1.050 OPS, including a third of all his walks on the year.
Batting 4th: 2018 Didi Gregorius (173 tOPS+, 187 sOPS+)
The 2018 campaign was the first one with Stanton on the team, and the Yankees often elected to hit him third with Judge in the two spot. That left Gregorius as an unconventional cleanup hitter, although you might not have known that he was if you just looked at his stats there. Hitting behind the two large boys helped Didi to a career year, as he had a .748 slugging percentage in the cleanup spot.
Batting 5th: 2023 Harrison Bader (163 tOPS+, 120 sOPS+)
With that 120 sOPS+, Bader was genuinely better hitting fifth than most other hitting there. He was also just so much better there than when he hit anywhere else. His .826 OPS in the five hole in 2023 isn’t awe-inspiring, but it’s funny how much better it is than his overall .643 with the Yankees that year, which ultimately got him waived in late August. This might be the purest form of what I was trying to find in making this lineup.
Batting 6th: 1987 Gary Ward (189 tOPS+, 159 sOPS+)
However, we have now immediately found someone that may be an even purer form. Gary Ward’s 1987 with the Yankees wasn’t especially great either, as his .675 OPS graded out to a 78 OPS+. However, hit him sixth and he turned into a legit slugger. He had 131 hits and 16 home runs in total that year, but if prorate what he did in the six hole and map out what he would’ve done over the whole season, he would’ve had 174 hits and 36 homers.
Batting 7th: 1950 Cliff Mapes (150 tOPS+, 161 sOPS+)
If Mapes was specifically hitting seventh in 1950, he became an absolutely on-base machine. He drew 17 walks there in 124 plate appearances, posting a .402 OBP. That’s almost as high as his slugging for the entire 1950 season: .421.
Batting 8th: 1999 Jorge Posada (170 tOPS+, 182 sOPS+)
Posada’s big breakout would come in the 2000 season, as he was still a below average hitter on the whole in the 1999. However, he showed signs of what was to come in the future, specifically hitting eighth in 1999. Sixteen of his 33 extra-base hits came there, as his 1.004 OPS was nearly 300 points higher than his overall season one.
Batting 9th: 2019 Mike Tauchman (157 tOPS+, 272 sOPS+)
Mike Tauchman was one of the embodiments of the 2019 “Next Man Up” Yankees where it seemed like everyone who got playing time ended up contributing in a positive way. Acquired in a then-quiet deal with the Rockies for reliever Phillip Diehl at the end of spring training, the Sock Man’s overall season numbers that year were very good, but in the nine hole especially, he hit .356/.440/.683.
View Link
Read the full article here