


The Rays have completed their first week of games facing off against a pair of NL Central teams. Below are five early trends to watch as the Rays look to build momentum in April. It’s still early, but these indicators can give us a directional sense of what’s real and what might regress.
36.7%
is the zone-minus-out-of-zone swing rate for the offense so far – slightly better than average, and good enough for 13th in the league. This group showed plus swing decisions during the spring with a rate of 40.0%, and that trend is continuing into the regular season although a few hitters have shown slightly more early-count aggressiveness than they did in the spring. The eye test and data both support the high quality of at-bats we’re seeing from this Rays offense. I expect this to continue given the players they have on the 40-man roster as they settle in more during April.
79.6%
is the team’s contact rate so far. Again, this was a pretty obvious one to see coming when we look at the roster moves they’ve been making over the last ~10 months, and the Spring Training data supports this trend as well. The Rays offense is making contact at a comfortably plus rate, ranking 3rd in the league so far.
105.9mph
is the team’s 90th percentile exit velocity. They’re currently above-average here as well and have the 5th highest EV90 in the league. The above average raw power shown from the Rays hitters so far combined with the quality of at-bats and high contact rate has helped produce a strong and efficient offense. Yes, there’s some BABIP luck that we can expect to regress a bit eventually, but they project to be one of the better BABIP teams in the league given their plus contact rate and how hard they’re hitting the ball.
59.3%
is the Rays combined line drive plus fly ball rate for the offense. This was an indicator I was a bit skeptical about heading into the regular season as it was just 46.0% in the spring and near the bottom of the league. However, they’ve done well to improve on this number so far compared to their Spring Training data and the 46.6% (last in the league) they showed in 2025. This will be something to monitor as a higher rate can raise the offensive ceiling of the group. It’s unlikely they sustain a top 10 mark over a full season, but even settling in around league average would represent a meaningful step forward from 2025.
66.5%
is the rate at which batted ball events are being converted to outs by the defense – the 9th lowest in the league. This is not a red flag yet as it’s still early, but it’s maybe a yellow flag – the defense is simply allowing too many additional outs and extra bases. The outfield has been pretty solid at 66.1% on their own (average for the outfield is 60.7%), so it’s mainly the infield and their 82.6% (average for the infield is 89.1%) which ranks near the bottom of the league. Given that they have average or better defenders at every infield position, this should improve over a larger sample. This is something to monitor through April, especially with a heavier divisional schedule coming in May.
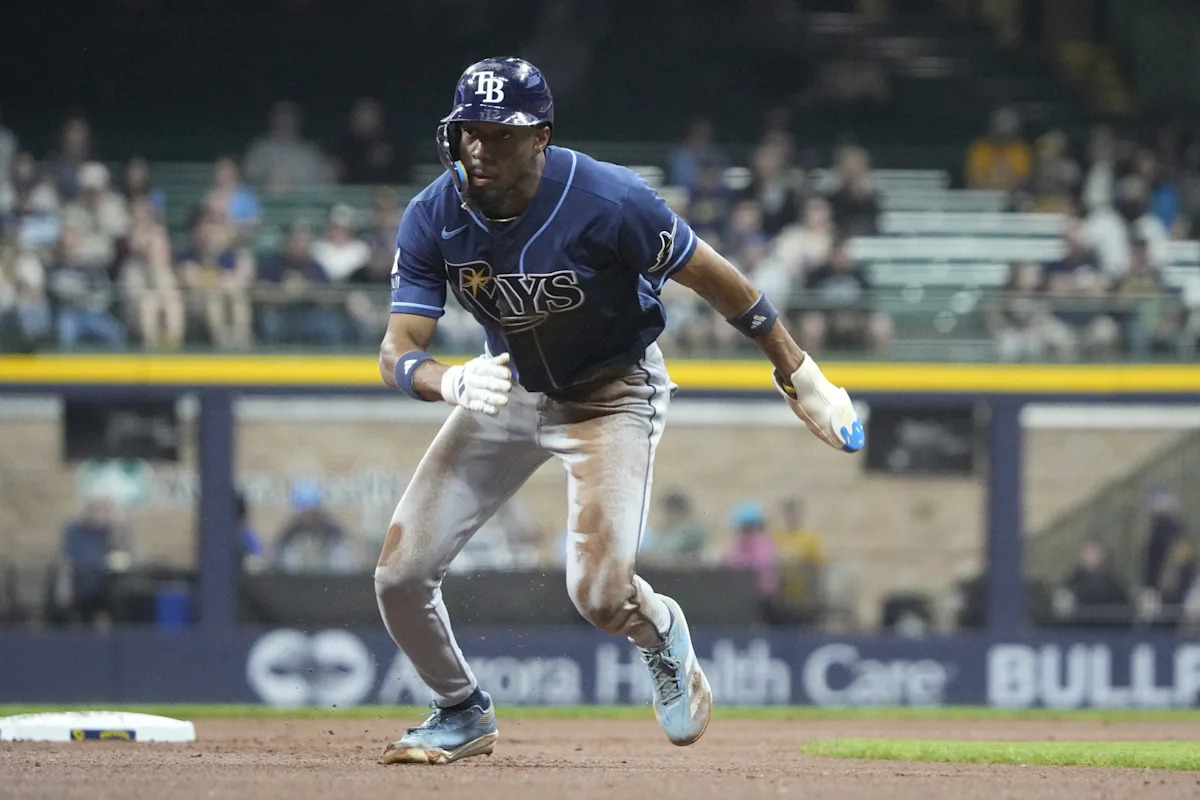
Just as a small side note, Chandler Simpson has been one of the most impressive defenders on the team so far this season. He had a strong spring, and that has translated well into the regular season. He has made several impressive catches with relative ease, including this one with a 20% catch probability and this one with a 50% probability. The only blemish is this opportunity with a 10% catch probability that he nearly turned into an out. The reactions and routes are night and day difference from 2025, and it’s easy to see a path to him earning a larger role.
Read the full article here


